The Matrix


- View customized variables in interactive scatterplots and maps
- Track progress over time through longitudinal data
- Export cleaned and reconstructed data for further analysis
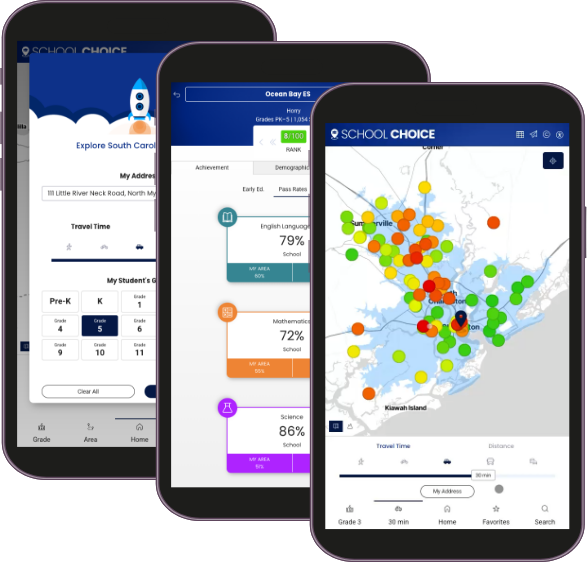
- Use your mobile phone to understand schools in your area based on simplified quality measures
- See your top choices on a map to explore distance from home or work
- Save and share search results
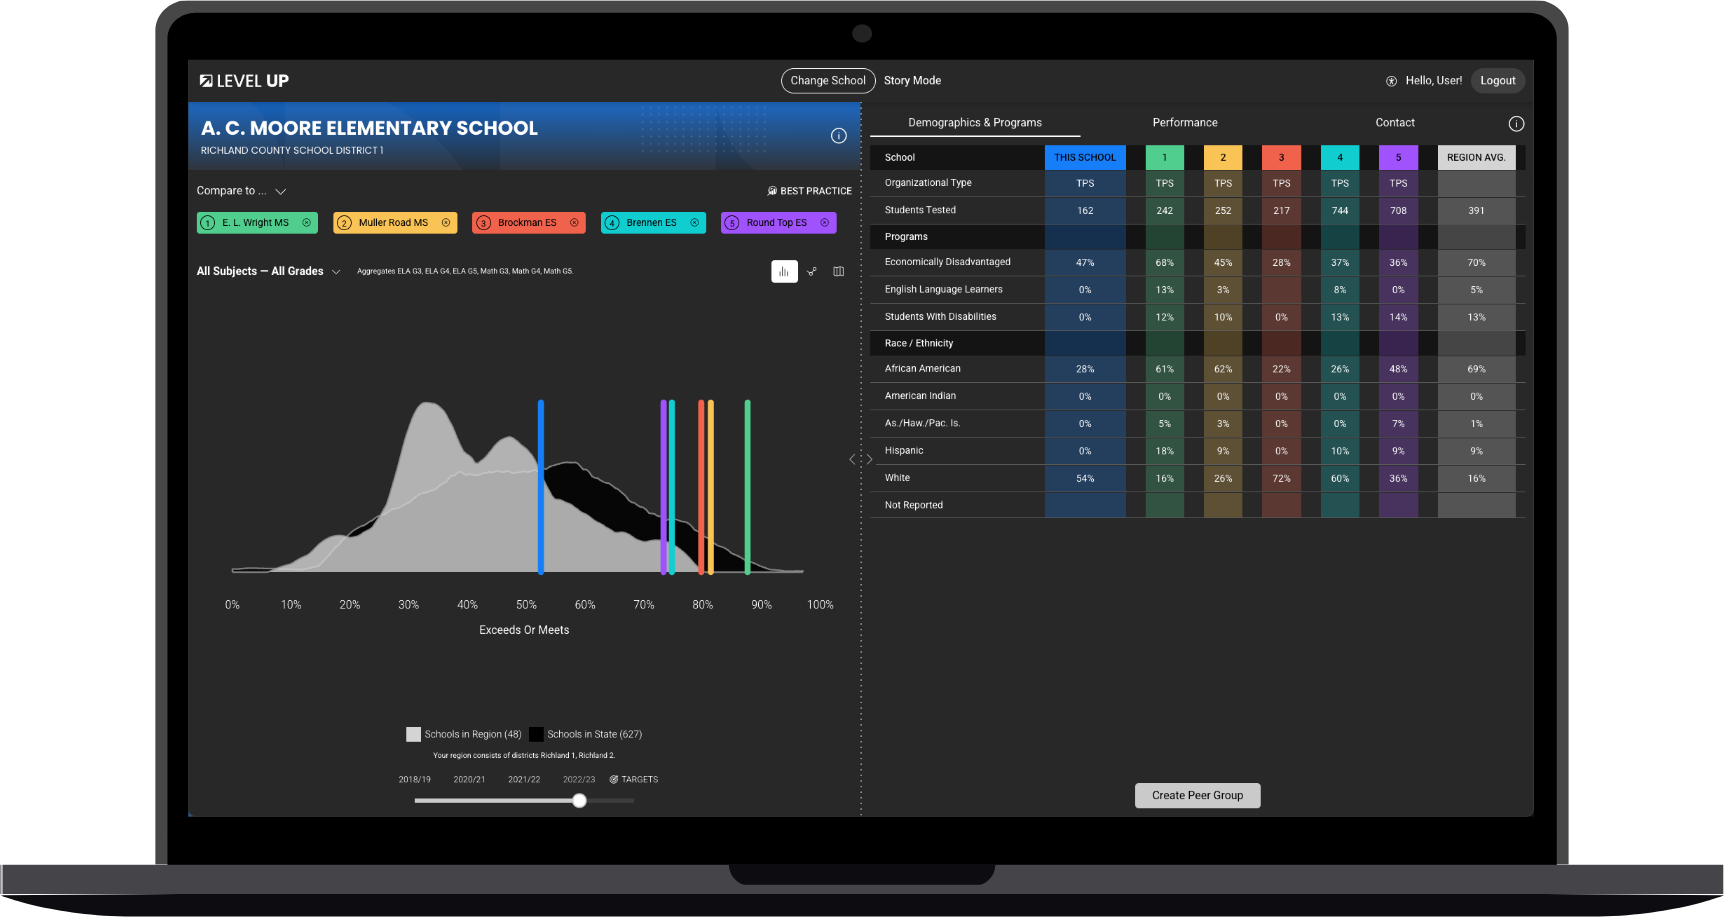
- Utilize outcome and demographic data to support instructional leaders' efforts
- Set targets for improvement by breaking down what it takes to get to the next level
- Identify high-performing peers who can serve as resources for best practice
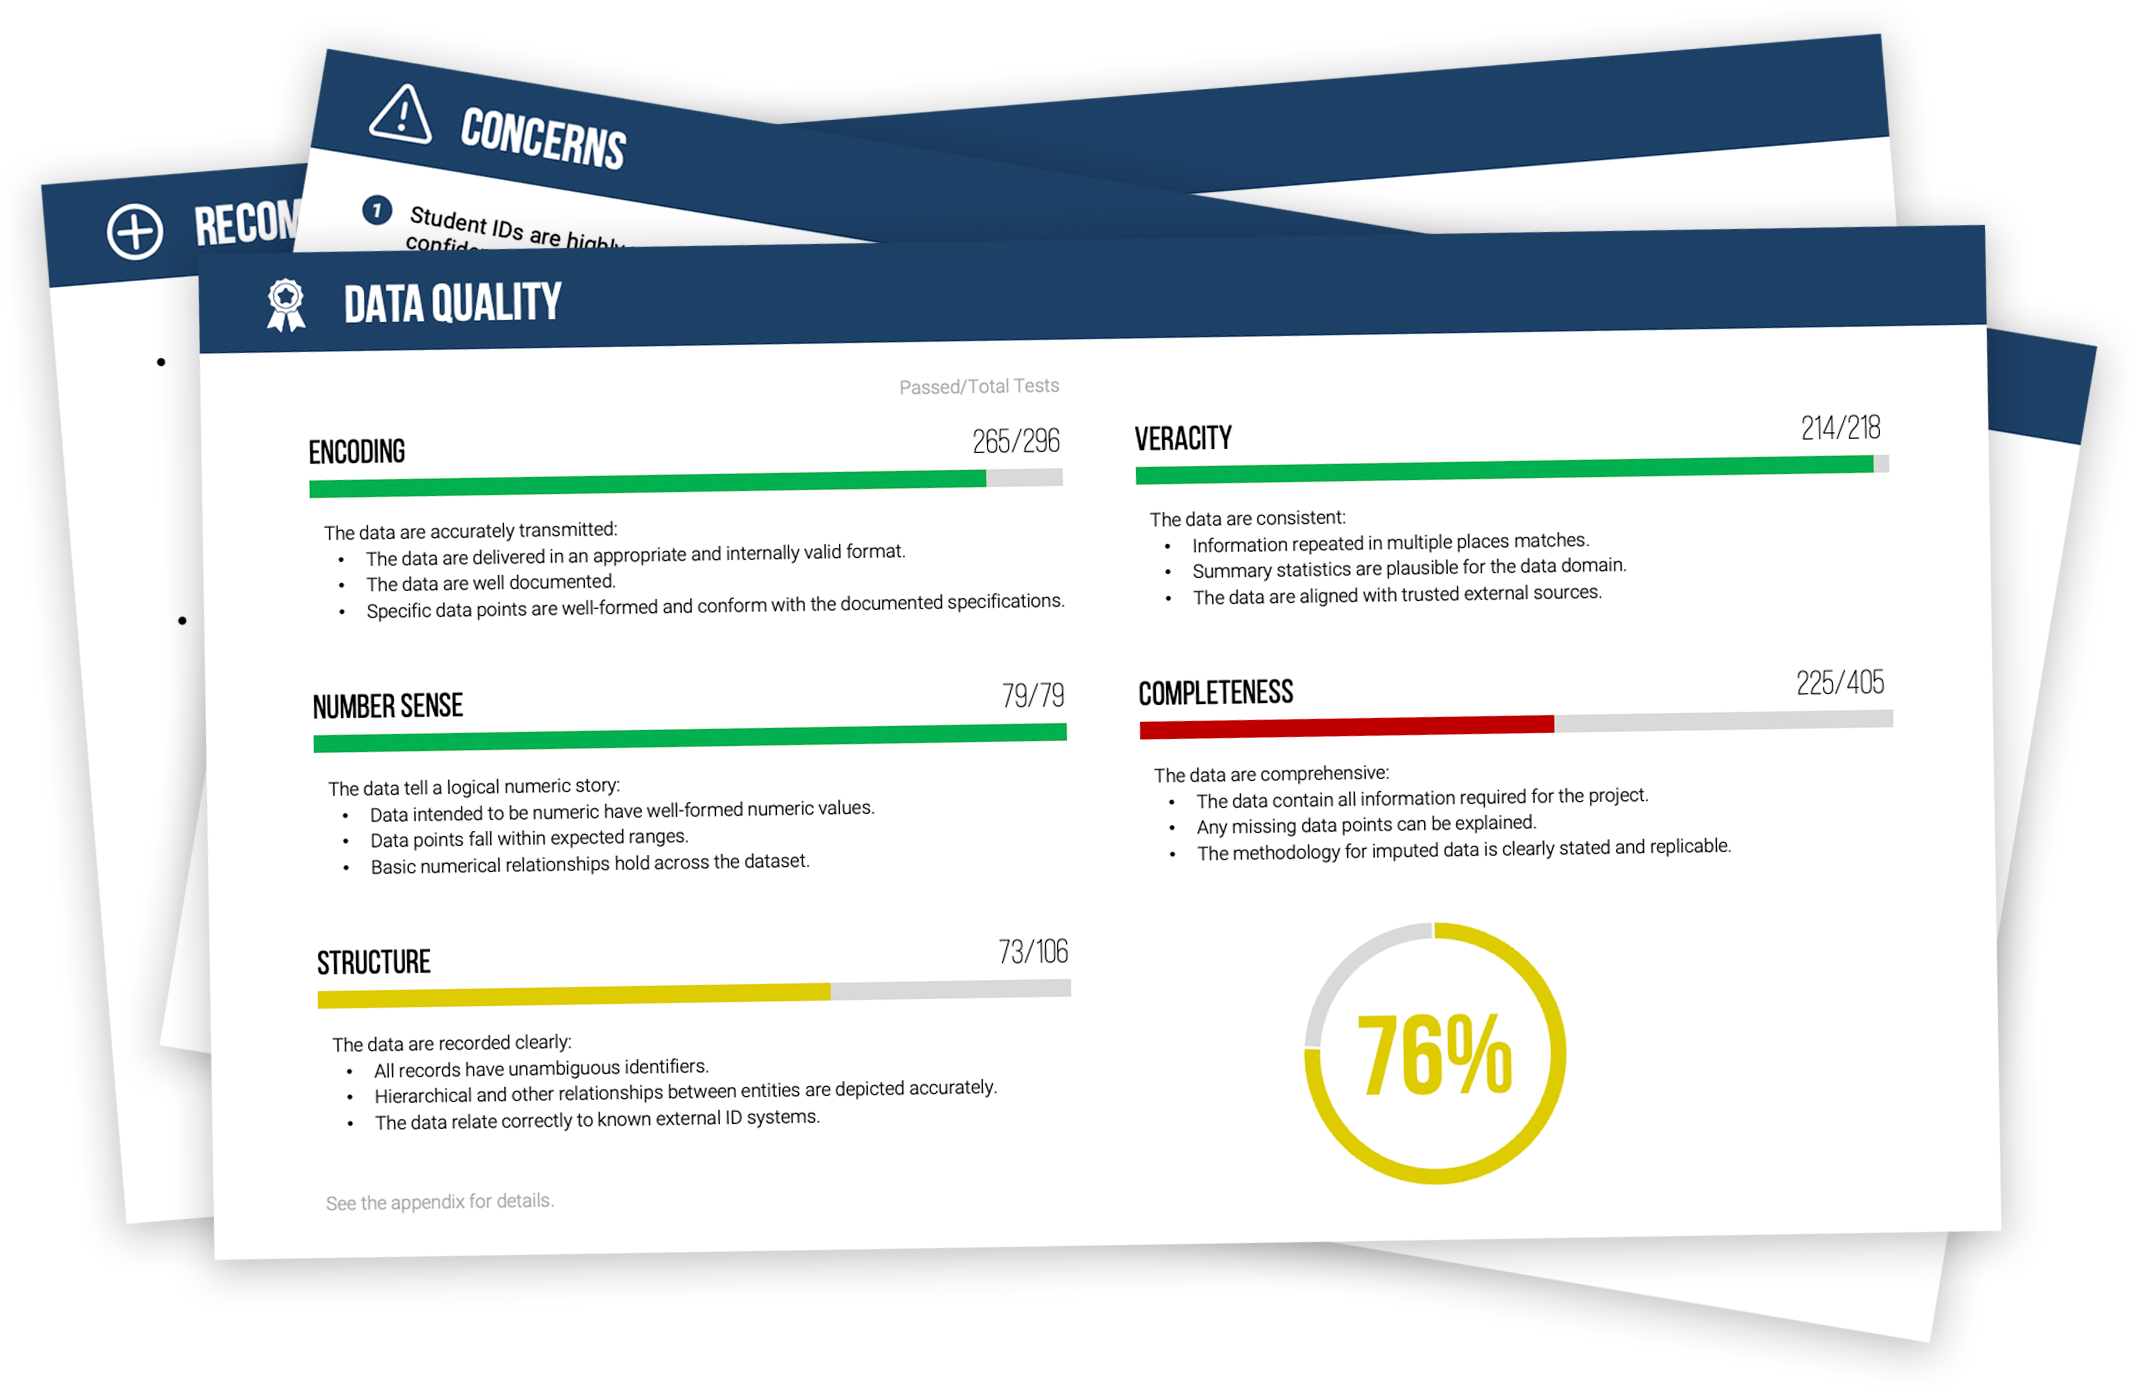
- Review of targeted data sets to ensure they are error-free and complete
- Identify cause of inconsistencies and establish new or changed business rules
- Support process updates to ensure quality data
Data Visualizations Tailored to Your Needs!
Web Accessibility Delivering Data Insights to All of Our Users
-
Compliant
Fully conformant with WCAG 2.1 level AA web accessibility standards
-
Inclusive
Solutions for users with light sensitivity, low vision, or color vision deficiencies
-
Intuitive
Accessibility interface that provides UI and design-related adjustments
No Colorblindness
Colorblind* Without
ESC Accessibility Colorblind* With
ESC Accessibility *Example simulates red-green color blindness.
ESC Accessibility Colorblind* With
ESC Accessibility
*Example simulates red-green color blindness.
Why ESC?

Fully Configurable
Our web applications are fully configurable, allowing you to adapt any features, designs, and functionalities to your specific needs.

Timely and Reliable
At ESC, we provide rapid, data-driven insights that empower you to make informed decisions with confidence.

Automated Data Pipeline
Our automated data pipeline streamlines the collection, processing, and analysis of your data, ensuring efficiency and accuracy at every step.
Current & Past Partners